Prometheus Exporter
1. Overview
In general, developers want to monitor the success rate of some PGOS API requests, as well as some data metrics. You can monitor PGOS metrics by viewing the dashboard on the PGOS portal, but if you need to customize the dashboard and monitoring rules, PGOS provides the PrometheusExporter to help you import data metrics into Prometheus, then you can use Grafana to customize the alert rules and show a custom dashboard on the game side.
You can download the source code of PrometheusExporter from the portal download page, it contains a file "README.md" that guides you on how to build and run PrometheusExporter quickly.
2. Scenarios
PrometheusExporter has the following two usage scenarios, both of which can be used together.
Import PGOS Metrics into Prometheus
If you particularly care about certain metrics, such as CCU, you can use PrometheusExporter to import the CCU metrics into the Prometheus deployed by yourself, and then configure the alert rules for the CCU via Grafana.
Use PrometheusExporter as a proxy for the Prometheus Redis/MongoDB metrics exporter deployed in the PGOS Virtual Server.
If you particularly care about metrics of virtual server storage (Redis or MongoDB), you need to configure custom alert rules. For example, if you want to monitor the Redis memory usage, you can deploy Prometheus Redis Metrics Exporter to the virtual server, then use PrometheusExporter as a proxy to import Redis metrics into the Prometheus deployed by yourself, and then use Grafana to display Redis memory usage and configure alert rules.
Prometheus and Grafana need to be deployed by yourself.
Grafana v7.4.3 or later is recommended.
Prometheus 2.26.0 or later is recommended.
3. Supported Metrics
You can get the supported metrics by PGOS from here: Metrics
4. How to Import PGOS Metrics to Prometheus
Build and run PrometheusExporter
Build
cd prometheusexporter
make
Modify Configuration File:
release/cfg/config.yaml提示Please fill in the correct parameters on <...>
title_id: <your title id>
encrypted_server_key: <your encrypted server key>
title_region_ids:
  - <your title region id>
metrics:
  - all
prometheus:
  ip: 0.0.0.0
  port: 8090
Run
cd release
bin/prometheusexporter -cfg=cfg/config.yaml &
Testing
curl http://localhost:8090/metricsIf you can get the metrics data normally, it means it is running properly.
Modify Prometheus Configuration
Add a block to the
scrape_configsof your prometheus.yml config file, and then reload it.scrape_configs:
- job_name: pgos_prometheus_exporter
static_configs:
- targets: ['<PGOS-PROMETHEUS-EXPORTER-IP>:8090']Testing
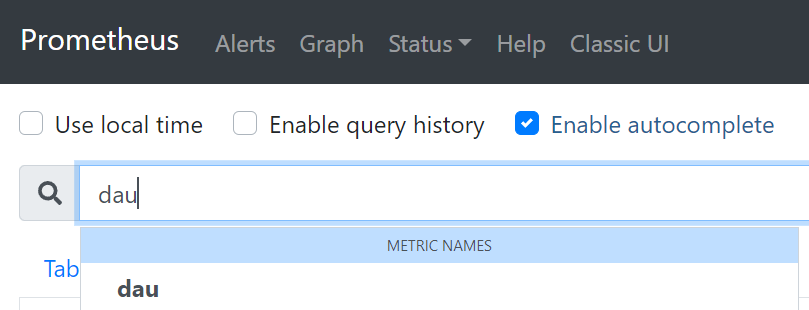
Go to Prometheus Web UI and search for a metrics name, if you can find the metrics, it means the metrics are imported successfully.
5. How to Import a Virtual Server Storage Metrics to Prometheus
Next, we take the Prometheus Redis Metrics Exporter as an example to show how to deploy Redis exporter in a virtual server to import Virtual Server Storage (Redis) metrics into Prometheus.
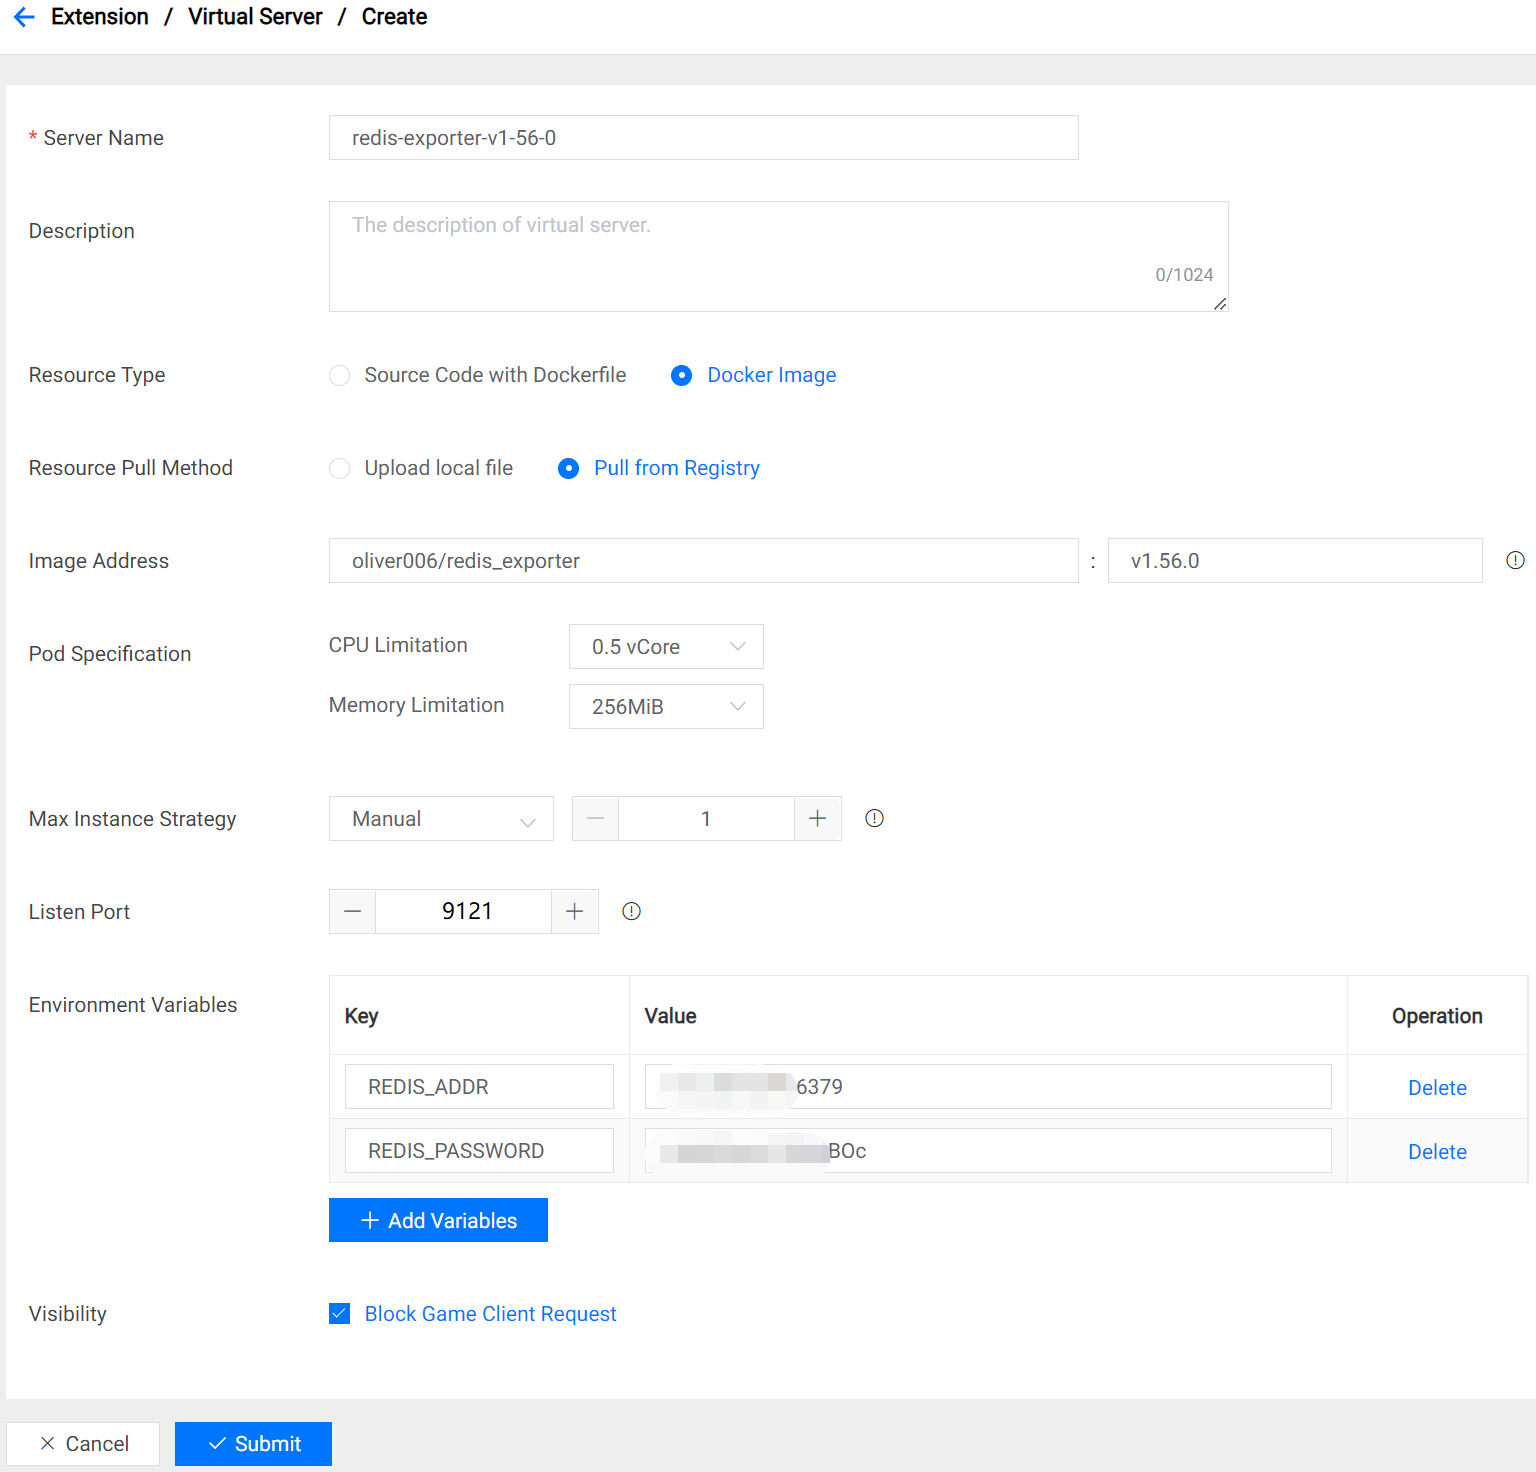
Add a virtual server, fill in the parameters as shown below, and click "Submit".
提示Environment variables need to be filled in the access address and password of virtual server storage Redis, access address format is like "172.16.0.1:6379".
Build and run PrometheusExporter
Build
cd prometheusexporter
make
Modify Configuration File:
release/cfg/config.yaml提示Please fill in the correct parameters on <...>
title_id: <your title id>
encrypted_server_key: <your encrypted server key>
prometheus:
  ip: 0.0.0.0
  port: 8090
vs_prometheus_proxies:
  - title_region_id: <your title region id>
    vs_name: redis-exporter-v1-56-0  # virtual server name
    proxy_port: 21088                # proxy listen port
Run
cd release
bin/prometheusexporter -cfg=cfg/config.yaml &
Testing
curl http://localhost:21088/metricsIf you can get the metrics data normally, it means it is running properly.
Modify Prometheus Configuration
Add a block to the
scrape_configsof your prometheus.yml config file, and then reload it.scrape_configs:
- job_name: redis_exporter
static_configs:
- targets: ['<PGOS-PROMETHEUS-EXPORTER-IP>:21088']Testing
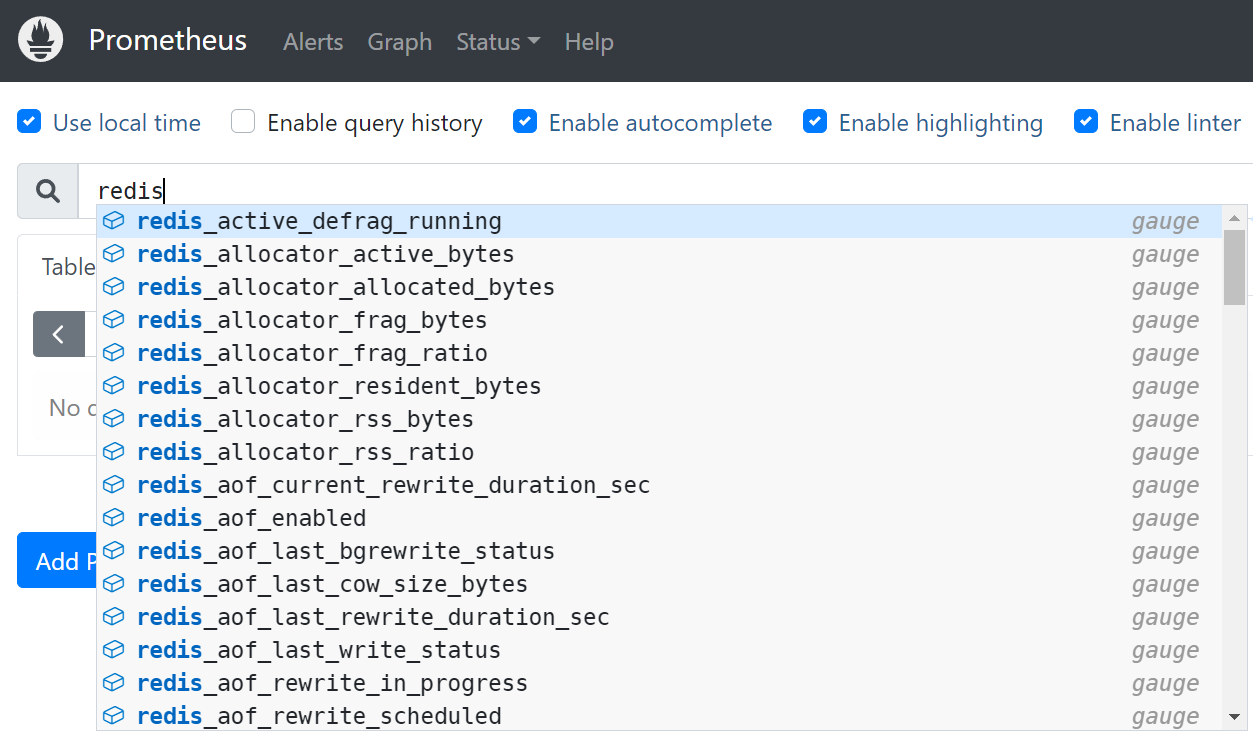
Go to Prometheus Web UI and search for "redis", if you can find some metrics, it means the metrics are imported successfully.
6. How to Monitor These Metrics Using Grafana
Make sure Grafana has added Prometheus as the default data source.
Display PGOS metrics.
The folder
prometheusexporter/dashboardcontains Grafana dashboard files provided by PGOS, which you can import on the Grafana Web UI.Display virtual server storage metrics.
You can search for the keywords "Redis" or "MongoDB" on Grafana portal to find the appropriate dashboard and then import it from the Grafana Web UI.
You can configure alerting rules on the Grafana Web UI if necessary.